US-Iran War and Stocks: Why This Time Is Different
The S&P 500 hit a record high 47 days into a war. But the reason behind the rally isn't what most people think.
This article was originally published on StockCram. Read the full breakdown with all 8 conflicts, 3 scenario analyses, and sector data →
I’ve been staring at the data for weeks and it still doesn’t click at first glance.
The S&P 500 hit an all-time record of 7,041 on April 16 — 47 days into a war with Iran. The Strait of Hormuz was effectively closed. Oil was near $95. A fragile ceasefire was barely holding. And the market just... kept going up.
If you read Part 1 of this series, the surface-level pattern looks familiar: markets drop on uncertainty, stabilize when conflict begins, recover within months. In 6 of 7 major conflicts since 1941, the S&P 500 was higher 12 months later.
But this time, the recovery is being driven by something that has nothing to do with the war.
That distinction is easy to miss — and it changes everything about how to read the market right now.
The Timeline (Fast)
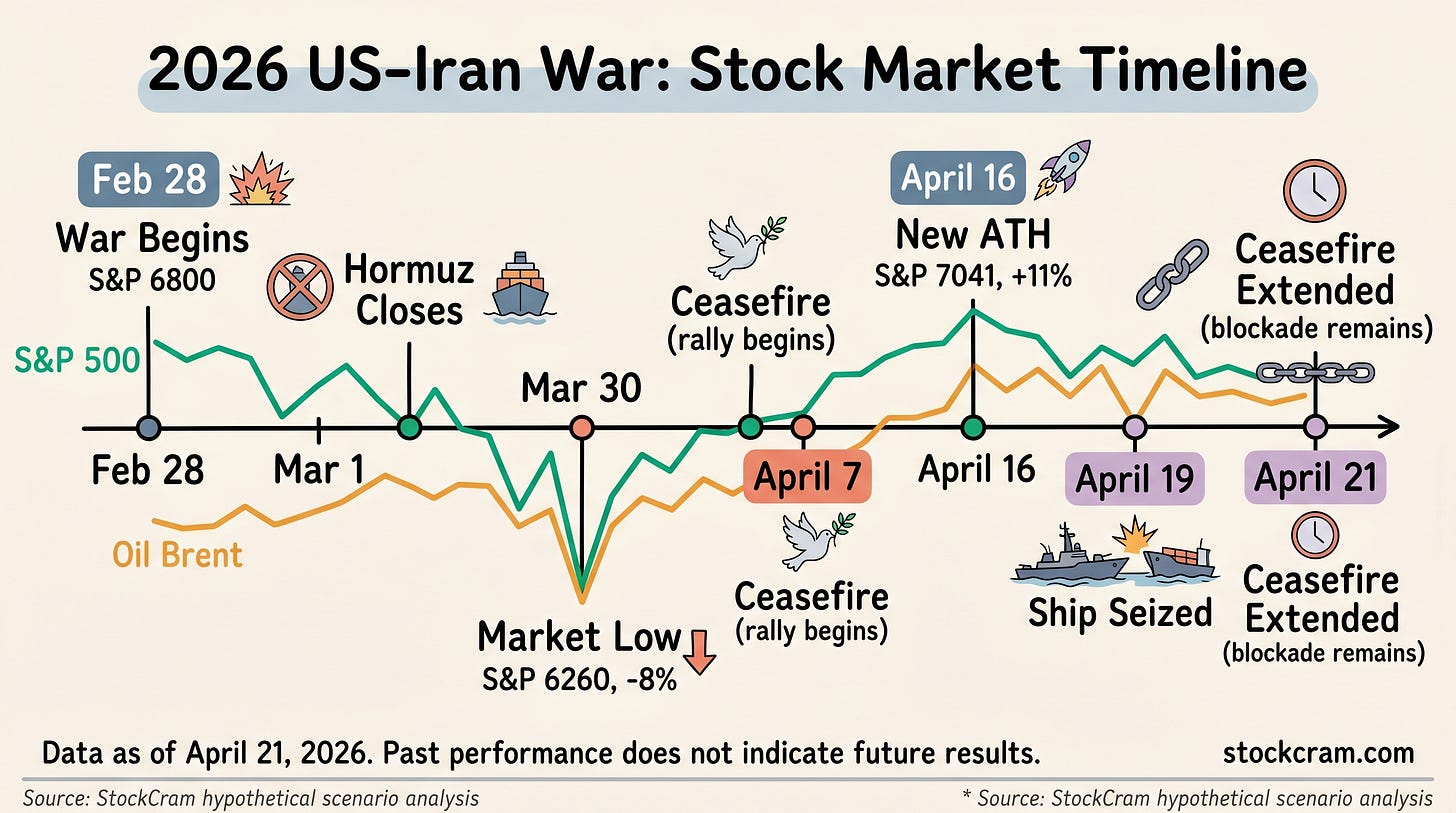
The speed of this cycle is unprecedented. From military strikes to ceasefire to all-time highs in under 50 days:
[
](https://substackcdn.com/image/fetch/$s_!HBUy!,f_auto,q_auto:good,fl_progressive:steep/https%3A%2F%2Fsubstack-post-media.s3.amazonaws.com%2Fpublic%2Fimages%2F4ed26cf6-7a4e-4a6f-8cbe-c2b912d3b93a_2752x1536.png)
S&P 500 fell ~8% from Feb 28 to March 30, then rallied +11% to a new all-time high by April 16. Past performance does not indicate future results.
The ceasefire on April 7 was the catalyst — exactly as the historical uncertainty premium pattern predicts. But here’s the catch: Trump extended the ceasefire on April 21 at Pakistan’s request, the naval blockade remains, Iran is dismissive of the terms, and no second round of talks has been confirmed.
The uncertainty isn’t resolved. It’s paused.
The Sector Data Breaks an 80-Year Pattern
This is the part that caught me off guard.
In every prior military conflict since 1941 — all seven of them — defense stocks outperformed. It was one of the most consistent patterns in the entire dataset.
The 2026 Iran war broke it.
[
](https://substackcdn.com/image/fetch/$s_!NeX0!,f_auto,q_auto:good,fl_progressive:steep/https%3A%2F%2Fsubstack-post-media.s3.amazonaws.com%2Fpublic%2Fimages%2F8fcd3544-74c4-45cb-8e51-9db074da2f15_2752x1536.png)
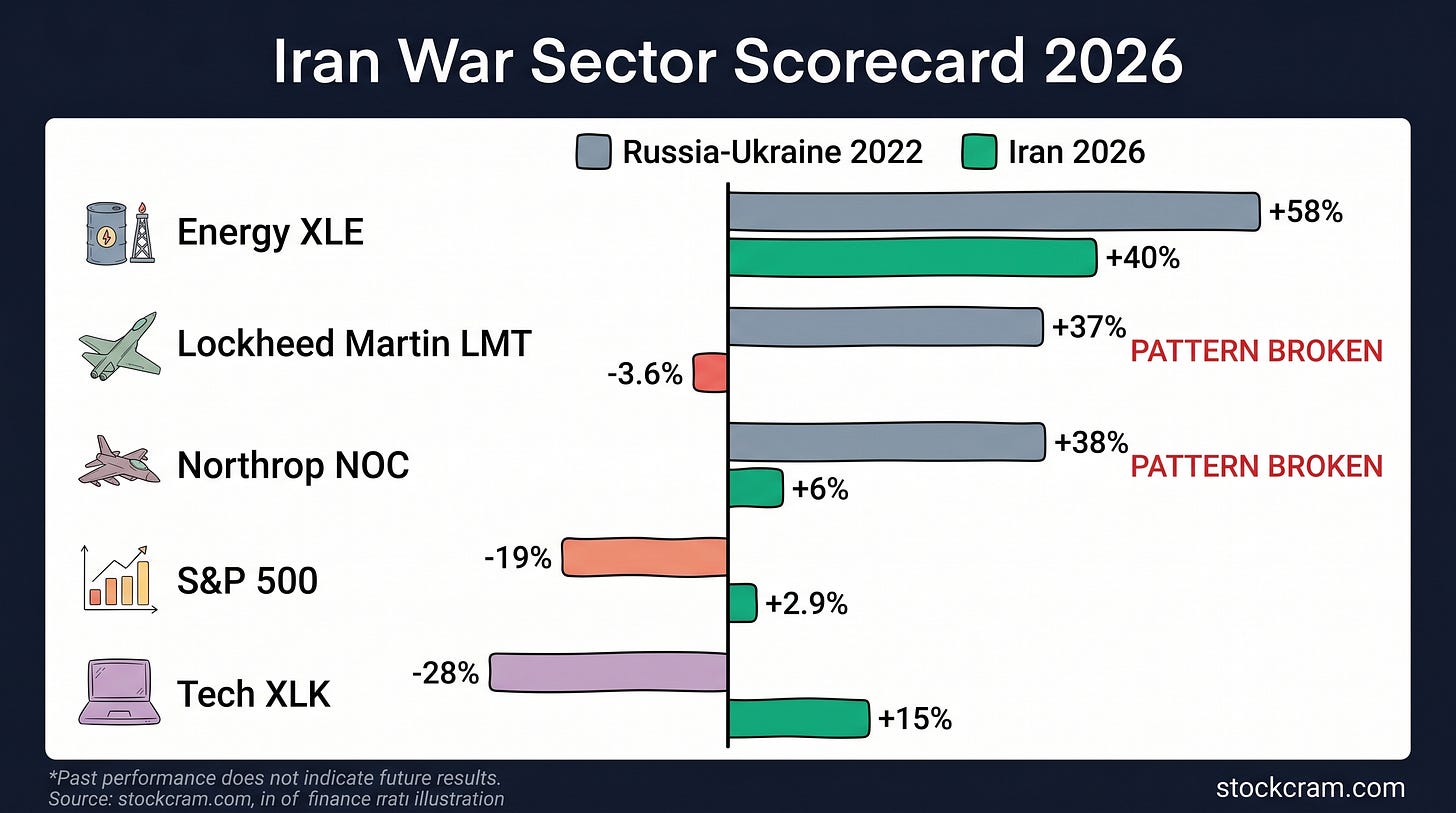
Energy leads at ~40% YTD while defense stocks have broken the 80-year pattern. Past performance does not indicate future results.
SectorRussia-Ukraine 2022Iran 2026 YTDEnergy (XLE)+58.3%~+40%Lockheed Martin (LMT)+37%-3.6%Northrop Grumman (NOC)+38%Initial +6%, fadedS&P 500-19.4%+2.9%Technology-28.2%Driving recovery
Energy is crushing it — XOM and CVX are both up ~40% year-to-date. But defense? Lockheed Martin is down 3.6% for the year. During Russia-Ukraine, it gained 37%.
Why? The Iran war is air/naval/cyber — not a ground war requiring massive new equipment. Much of the spending goes to existing munitions, not new platform orders. And defense valuations were already elevated before the war started.
StockCram is not affiliated with any brokerage mentioned in this post.
The Part Most People Miss
Here’s the real story: the market isn’t recovering because of the war. It’s recovering because of AI.
The S&P 500 is market-cap weighted. In 2026, a handful of tech mega-caps — Apple, Nvidia, Microsoft — account for an outsized share of the index. These companies are, as one analyst put it, “running on their own dynamic independent of anything, including the war.”
The equal-weighted S&P 500 — where every stock counts the same — tells a very different story. Most stocks haven’t fully recovered. The mega-caps are masking the pain.
So when you hear “the war is priced in” — that’s not quite right. AI spending is priced in. The war isn’t resolved.
And if the ceasefire collapses, the historical template has no answer for what happens next. No prior conflict in the 80-year dataset had a fragile diplomatic pause that could unravel.
What I’m Watching
The ceasefire extension buys time, but the sticking points are real:
-
Uranium enrichment: US wants a 20-year pause, Iran offers 5
-
Naval blockade: US maintaining it; Iran calls it “an act of war”
-
No confirmed talks: Iran hasn’t agreed to a second round
The Strait of Hormuz is still effectively closed — that’s ~20% of global oil supply blocked. Even if a deal reopens it tomorrow, analysts estimate months for shipping to normalize.
The pattern is familiar — drawdown, ceasefire, recovery.
The reason behind it isn’t — and that’s what makes this market easy to misread.
The full analysis covers all 8 conflicts since 1941, 5 structural differences that make Iran unique, 3 ceasefire scenarios with sector implications, and the complete oil/Hormuz deep-dive:
→ US-Iran War and Stocks: Why This Time Is Different — Full Breakdown
StockCram publishes educational stock market content every week.
StockCram is an educational platform, not a broker-dealer, investment adviser, or financial institution. Historical data shown; past performance does not indicate future results.
Every subscription motivates me to keep writing.